This year is the 184
th birthday of
Dmitri Mendeleev, born 8
th Feb 1834. The story of the periodic table that he initiated is a nice example of
Science in Action and illustrates many aspects of how modelling & science relate. I will try and tease out some of this relating over time. But first an initial look at some of his modelling
 | | | | | |
| Picture courtesy The Royal Society and Facebook |
|
|
|
|
|
|
The Mendeleev table, fig 1, dates from 187 when there were only 66 known elements. A table from 2016, fig 2, contains 118 elements.
 |
| Fig 1 Mendeleev's Periodic Table, 1871 |
Both tables show the symbols and weights of the elements (fig 2 also includes the names of the elements), and the elements are organised in rows and columns. The columns group elements with similar chemistry. This is made explicit in the Mendeleev table by showing, symbolically, how the element combines with oxygen and with hydrogen in each group label. We can also see, in both tables, that the weights follow a sequence.
 |
| Fig 2 Modern Periodic Table, 2016 Edition |
Mendeleev's table however is more than a simple classification. There is a more sophisticated set of relations between the properties of elements represented by their relative spatial relationships in the table. This is visible in the Mendeleev table in that there are gaps where no known element exhibited the properties required for that location. The gaps are shown as dashes in his table, for example a gap at position, group3/row4. He went further than this though, he predicted the properties required from an element that would fill the gap. And indeed, in time, new elements were discovered with these properties and the gaps were filled.
Mendeleev's story is typical of that of natural science at that time, i.e. pre-1900. Most of the phenomena that constituted chemistry in the nineteenth century could be explained in macroscopic terms i.e. direct observation. However new technology was beginning to open up a microscopic world, indirect observations via specialist tools. For example, observing the colour in a flame when a substance was burned, fig 3, was being supplemented by using prisms etc, fig 4, to analyze the colour, into spectra, fig 5.
 |
| Fig 3 Colour in flames |
 |
| Fig 4 Generating a spectrum |
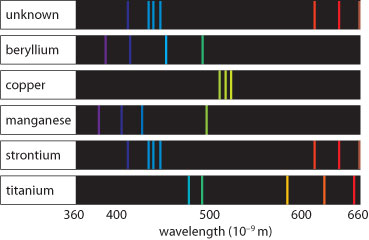
 |
| Fig 5 Identification of Strontium by its spectrum |


Comments
Post a Comment